WJPr
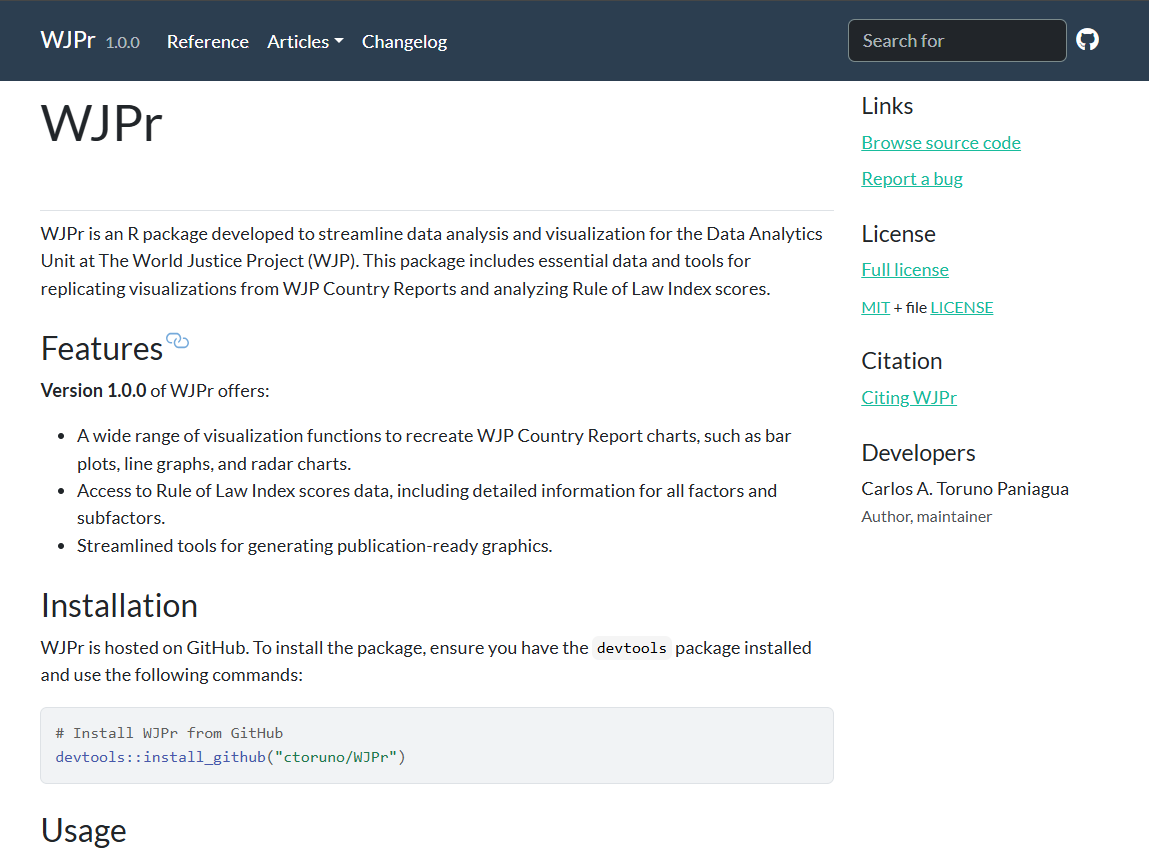
WJPr is an R package developed to streamline data analysis and visualization for the Data Analytics Unit at The World Justice Project.
What it’s about
An R package built to streamline data analysis and visualization for the Data Analytics Unit at the World Justice Project (WJP). It packages together the datasets and plotting tools needed to replicate visualizations from WJP Country Reports and to analyze Rule of Law Index scores — turning a process that used to mean rebuilding the same charts by hand for every country report into a few function calls.
Stack
- Language: R (100% of the codebase)
- Distribution: GitHub, installable via
devtools::install_github() - Documentation: pkgdown site at ctoruno.github.io/WJPr
Features and how it works
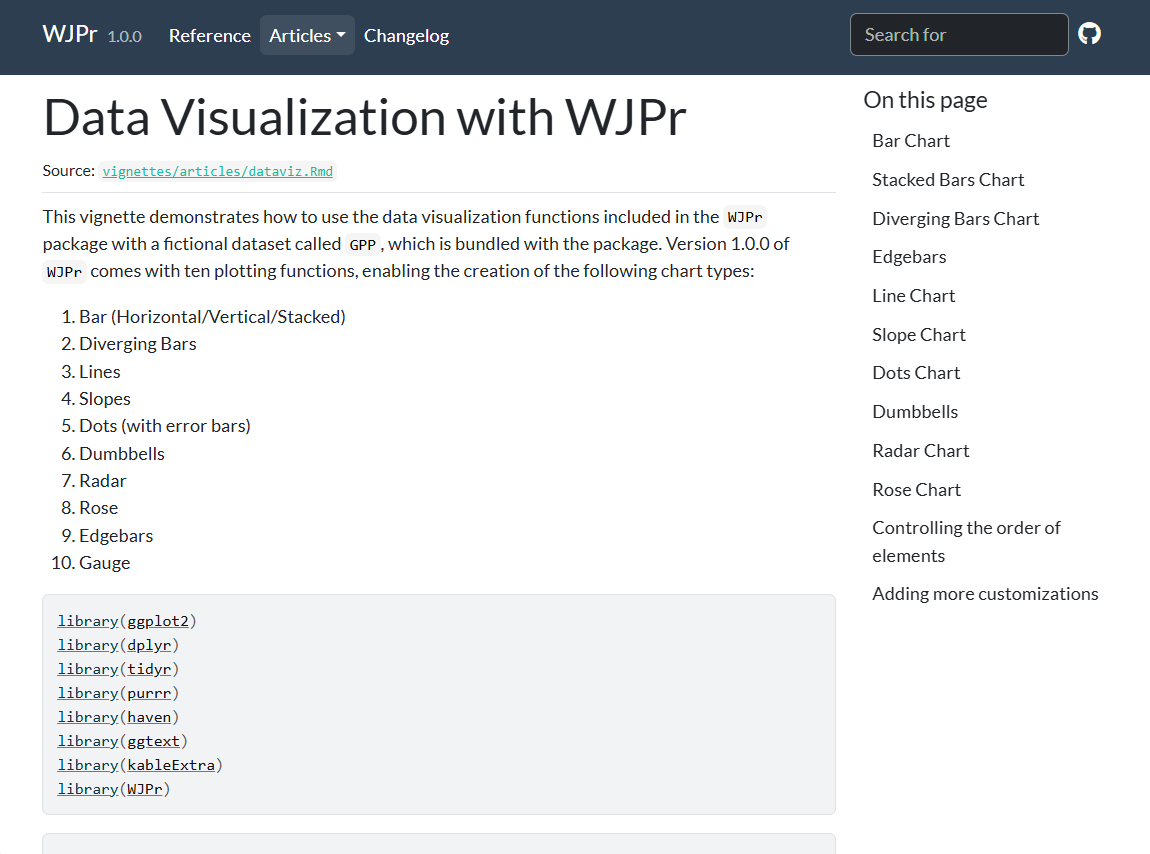
The package bundles Rule of Law Index data directly (factor and subfactor level detail included, e.g. WJPr::roli) alongside a set of visualization functions — bar plots, line graphs, and radar charts — styled to match WJP’s Country Report house style, including WJP’s custom fonts and color themes loaded via wjp_fonts(). The goal was consistency: any analyst on the team can generate a publication-ready chart that matches the visual identity of official WJP reports without rebuilding the styling from scratch each time.
Quick example
library(WJPr)

wjp_fonts()

data4bars <- WJPr::gpp %>%
  select(country, year, q1a) %>%
  group_by(country, year) %>%
  mutate(
    trust = case_when(q1a <= 2 ~ 1, q1a <= 4 ~ 0, q1a == 99 ~ NA_real_),
    year  = as.character(year)
  ) %>%
  summarise(trust = mean(trust, na.rm = TRUE) * 100, .groups = "keep") %>%
  filter(year == "2022")

wjp_bars(
  data4bars,
  target   = "trust",
  grouping = "country",
  colors   = "year",
  cvec     = c("2022" = "#8789C0")
)
Full documentation for all functions and datasets is available through R’s help system (e.g. ?WJPr::wjp_lines) and on the package site.
License
Released under the MIT License. Developed by the Data Analytics Unit at the World Justice Project. Source: github.com/ctoruno/WJPr.